Capacity you can plan with
How many live channels one NVIDIA GPU transcodes into an ABR ladder — measured with real broadcast captures, one channel at a time, until a limit stopped the ramp.
How we measure
Ramp, one channel at a time
The ramp tool adds transcoded channels one by one. Each channel is fed by a real broadcast capture, looped locally and sent PCR-paced, so the transcoder sees a live stream in real time.
Stop at the first limit
The ramp stops at the first channel that runs slower than real time or restarts, when NVENC or NVDEC reach the guard, or when the CPU guard trips.
The guard
The guard is a utilisation ceiling (85 % on the RTX 4000 SFF Ada, 90 % on the RTX PRO 4500 Blackwell) that leaves headroom for peaks: short NVENC spikes are well above the average (on the Blackwell run 79 % on average, 94 % at the peak).
NVIDIA RTX PRO 4500 Blackwell (32 GB GDDR7)
One of the server’s two GPUs; the GPU was otherwise idle. Ladder: 1080p (4.5 Mbit/s), 720p (2.5 Mbit/s), 360p (0.6 Mbit/s) H.264 + AAC.
| Sources | Ladder | Filters | Channels | Stopped by | GPU | NVENC | NVDEC | Memory | Power |
|---|---|---|---|---|---|---|---|---|---|
| 1080i25 H.264 | 3 renditions, 1080p/720p/360p | dynamic | 25 | NVENC guard (90 %, peak 94 %) | 9.4 % | 79 % | 35 % | 14.7 GB | 83 W |
Whole GPU, averaged over each step. The ramp stopped at 25 channels when NVENC peaked at 94 %.
Data table
| Channels | NVENC | NVDEC |
|---|---|---|
| 0 | 0.0 % | 0.0 % |
| 1 | 2.5 % | 1.0 % |
| 2 | 6.9 % | 3.1 % |
| 3 | 11.3 % | 4.8 % |
| 4 | 14.1 % | 7.5 % |
| 5 | 18.4 % | 8.9 % |
| 6 | 22.8 % | 10.5 % |
| 7 | 24.3 % | 10.9 % |
| 8 | 28.6 % | 13.8 % |
| 9 | 32.1 % | 13.6 % |
| 10 | 34.0 % | 15.5 % |
| 11 | 36.9 % | 15.5 % |
| 12 | 43.7 % | 18.9 % |
| 13 | 44.7 % | 19.8 % |
| 14 | 47.6 % | 21.5 % |
| 15 | 48.7 % | 22.9 % |
| 16 | 51.9 % | 23.1 % |
| 17 | 55.8 % | 24.3 % |
| 18 | 58.3 % | 27.0 % |
| 19 | 63.7 % | 27.3 % |
| 20 | 59.7 % | 26.2 % |
| 21 | 71.2 % | 30.1 % |
| 22 | 75.5 % | 30.5 % |
| 23 | 72.2 % | 30.3 % |
| 24 | 77.7 % | 33.1 % |
| 25 | 79.3 % | 34.9 % |
Per channel
- 3.0 % NVENC and 1.1 % NVDEC per 3-rendition 1080p ladder channel.
- About 590 MB GPU memory per channel; 25 channels used 14.7 of 32 GB.
- NVENC is the limit: at 25 channels the GPU’s shader cores were at 9.4 %, NVDEC at 35 %.
From the per-channel load: about 30 channels per GPU at 100 % NVENC, about 50–60 channels per server with two GPUs.
NVIDIA RTX 4000 SFF Ada Generation (20 GB)
Measured next to another media server running on the same GPU, which itself used about 22–35 % of NVENC/NVDEC. The utilisation figures include it. Ladder: 720p (2.0 Mbit/s), 576p (1.1 Mbit/s), 360p (0.6 Mbit/s) H.264 + AAC; the 2-rendition run without 576p.
| Sources | Ladder | Filters | Channels | Stopped by | GPU | NVENC | NVDEC | Memory | Power |
|---|---|---|---|---|---|---|---|---|---|
| 1080i25 H.264 | 3 renditions | full graph | 16 | a source format change, not capacity | 48 % | 69 % | 58 % | 14.1 GB | 67 W |
| 1080p50 H.264 | 3 renditions | full graph | 19 | NVENC guard | 54 % | 78 % | 56 % | 15.4 GB | 68 W |
| 1080p50 H.264 | 3 renditions | dynamic | 17 | NVENC guard (spike) | 38 % | 68 % | 54 % | 13.7 GB | 65 W |
| 1080p50 H.264 | 2 renditions, 720p/360p | dynamic | 30 | CPU guard, not the GPU | 46 % | 74 % | 70 % | 18.4 GB | 66 W |
Full graph: deinterlacer and background filter for every source. Dynamic: the deinterlacer runs only for interlaced sources and the background only when the aspect ratio differs (none for 16:9). With 1080p50 sources the dynamic filters cut GPU utilisation by about a quarter.
Whole GPU including the other media server (step 0: it alone). The ramp stopped at 30 channels on the CPU guard.
Data table
| Channels | NVENC | NVDEC |
|---|---|---|
| 0 | 24.0 % | 30.0 % |
| 1 | 26.2 % | 28.7 % |
| 2 | 29.1 % | 29.9 % |
| 3 | 28.5 % | 29.7 % |
| 4 | 32.8 % | 32.9 % |
| 5 | 33.7 % | 33.8 % |
| 6 | 33.6 % | 34.9 % |
| 7 | 36.1 % | 35.9 % |
| 8 | 37.1 % | 37.5 % |
| 9 | 40.5 % | 39.4 % |
| 10 | 43.2 % | 41.9 % |
| 11 | 44.1 % | 43.3 % |
| 12 | 44.5 % | 42.9 % |
| 13 | 45.1 % | 44.5 % |
| 14 | 51.1 % | 45.6 % |
| 15 | 47.7 % | 47.9 % |
| 16 | 52.6 % | 50.9 % |
| 17 | 56.9 % | 51.4 % |
| 18 | 54.6 % | 52.7 % |
| 19 | 56.9 % | 55.1 % |
| 20 | 57.6 % | 54.9 % |
| 21 | 60.3 % | 57.4 % |
| 22 | 57.1 % | 58.3 % |
| 23 | 59.7 % | 59.9 % |
| 24 | 63.3 % | 62.1 % |
| 25 | 64.4 % | 63.0 % |
| 26 | 66.9 % | 63.6 % |
| 27 | 70.0 % | 65.6 % |
| 28 | 74.7 % | 68.8 % |
| 29 | 71.7 % | 69.5 % |
| 30 | 73.6 % | 70.1 % |
Per channel
- About 1.7 % NVENC and 1.1 % NVDEC per 2-rendition channel.
- Fewer renditions are the strongest lever: 30 channels with 2 renditions against 17–19 with 3, on the same GPU.
- Dynamic filters cut GPU utilisation by about a quarter with 1080p50 sources; NVENC stays the limit.
Size your servers
Channels per GPU depend on the ladder (number of renditions, resolutions, bit rates), the source format (resolution, interlaced or progressive, aspect ratio) and the filters a source needs. Use the numbers above as a starting point and measure your own mix.
- Find the per-channel loadNVENC and NVDEC % per channel for your ladder and sources — from the tables above, or from a ramp on your hardware.
- Divide the usable sharechannels ≈ usable NVENC % ÷ NVENC % per channel; the same for NVDEC. The smaller result is your limit.
- Keep headroomPlan below the guard: peaks are higher than averages. Count GPU memory and the CPU (audio, packaging) too.
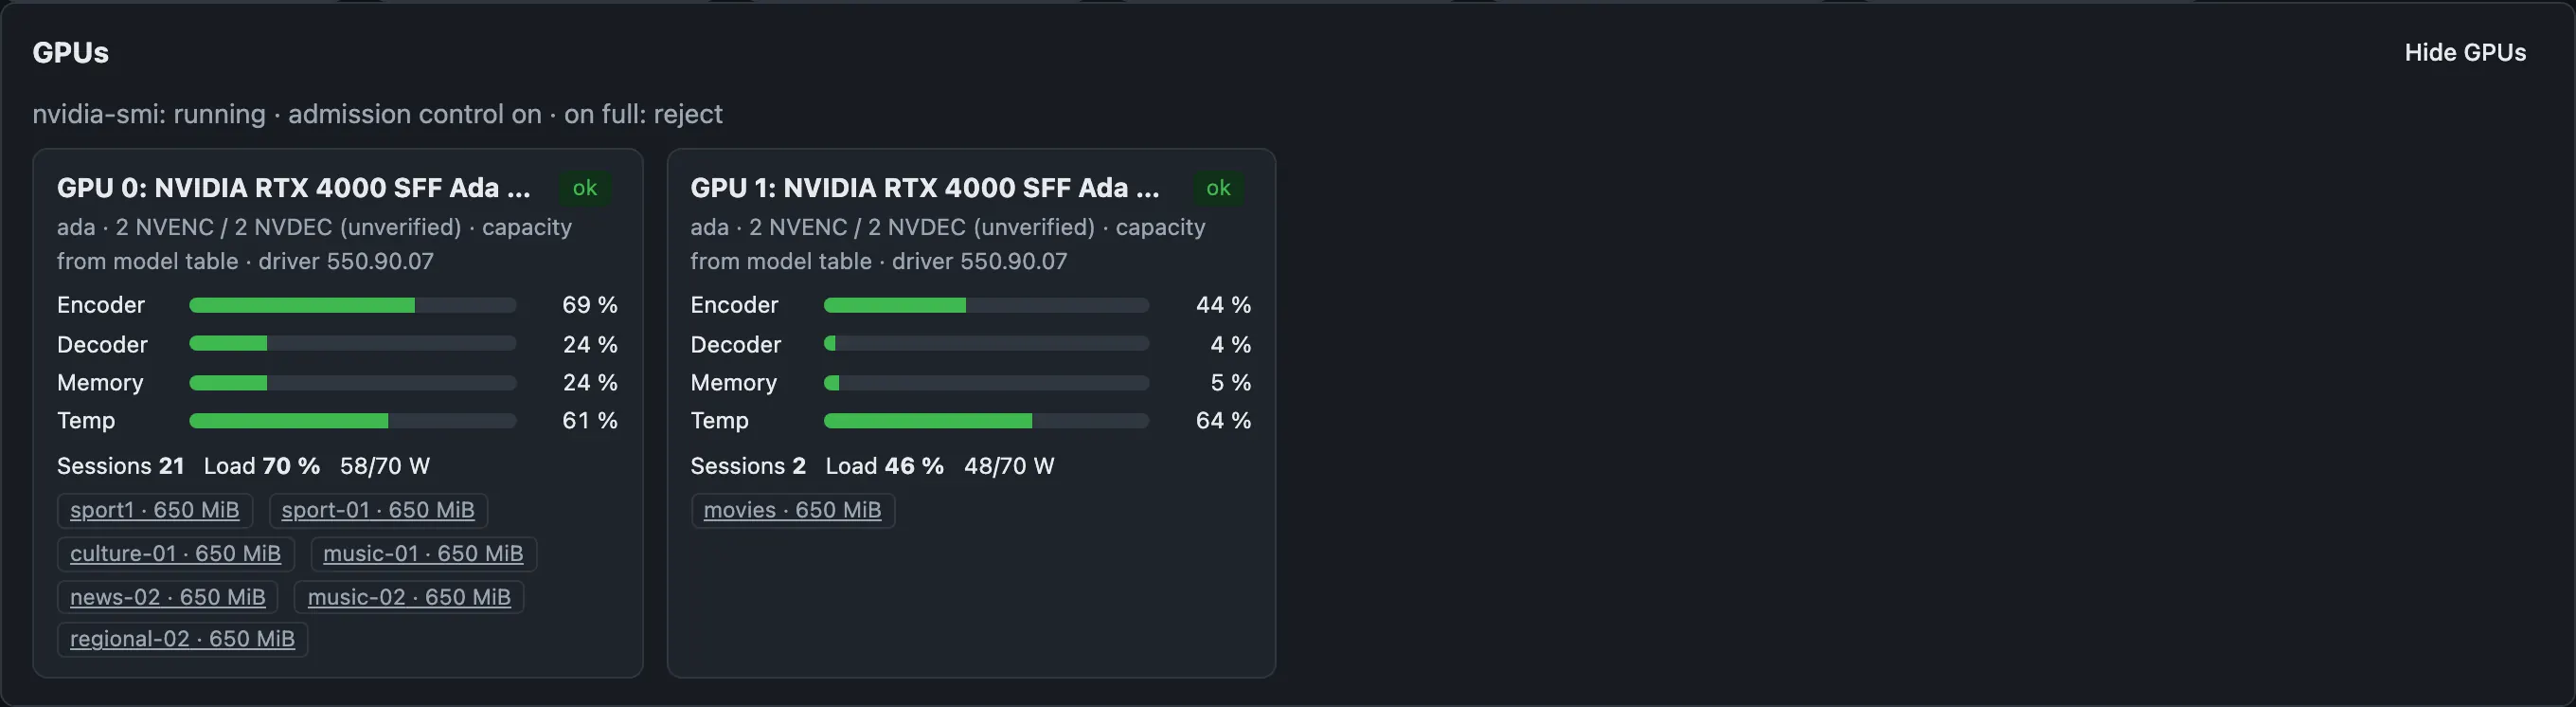
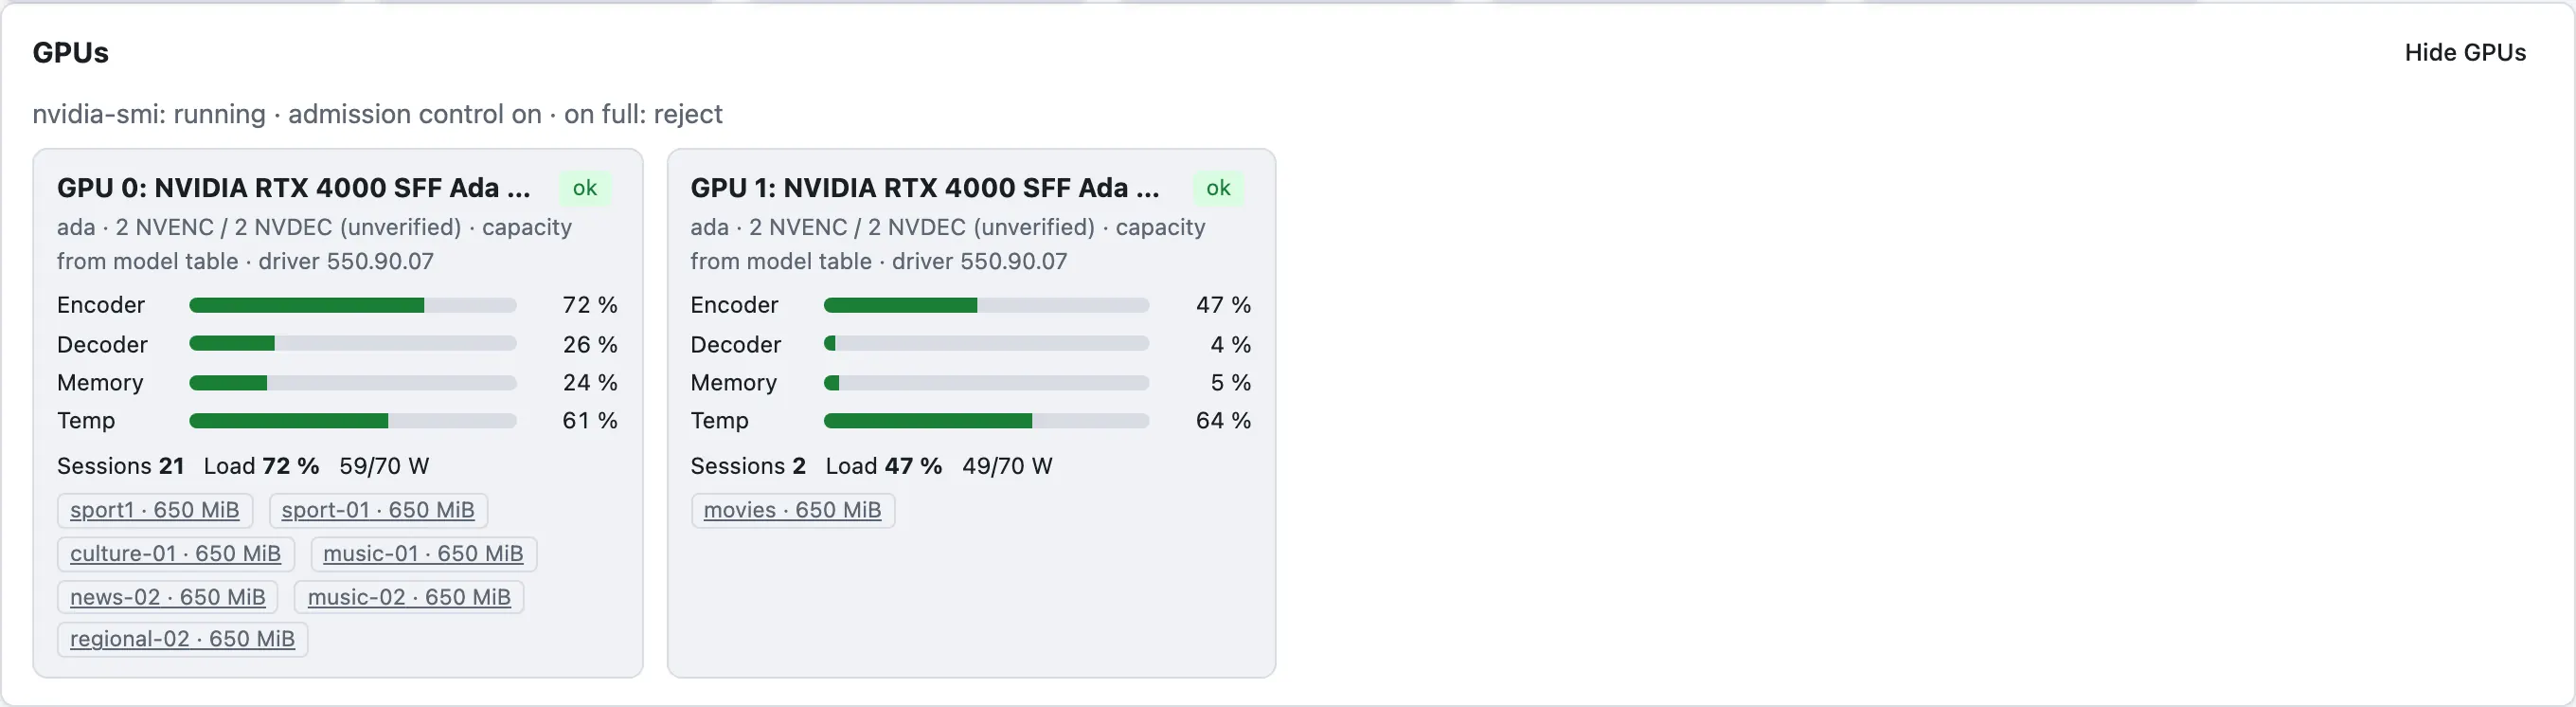
- Admission control keeps every GPU below its limits: a transcoder only starts where its estimated load fits.
- The capacity model per GPU model can be calibrated with your measured values.
Measure it on your own GPUs
The trial has every Pro feature, including NVIDIA transcoding and the GPU panel.